Land Rover Buying Opportunities: Models At or Near Their Price Bottom
These Land Rover models are depreciating or sitting at their price bottom right now: the moments buyers wait for. Ranked from verified auction sales, with live market values backed by real sold prices.
Data: DriveIndex, 246,000+ verified completed auction sales across 10,900+ cars from 25 sources; values recomputed Oct 10, 2026, latest verified sale Oct 9, 2026. Methodology
Land Rover Buying Opportunities: Models At or Near Their Price Bottom (30)
Market values from verified auction sales · click any car for its full price history, projection, and Value Signal.


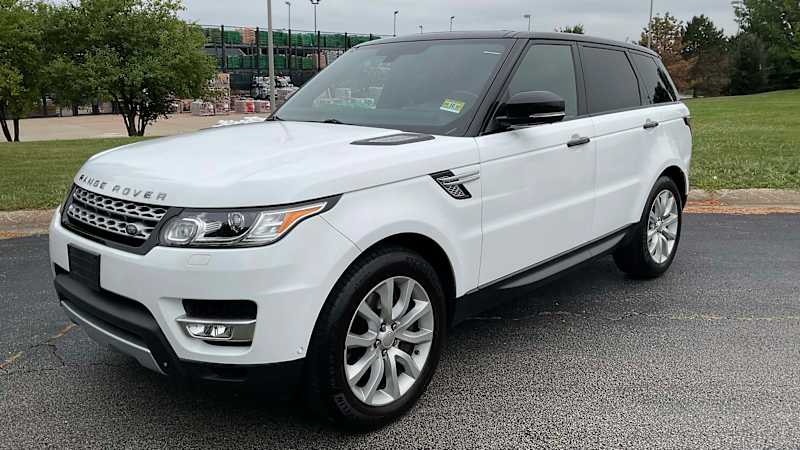


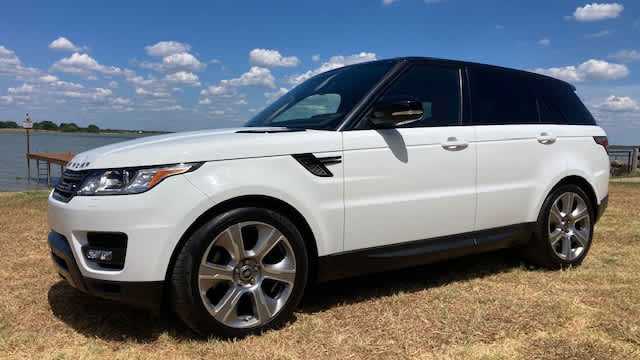

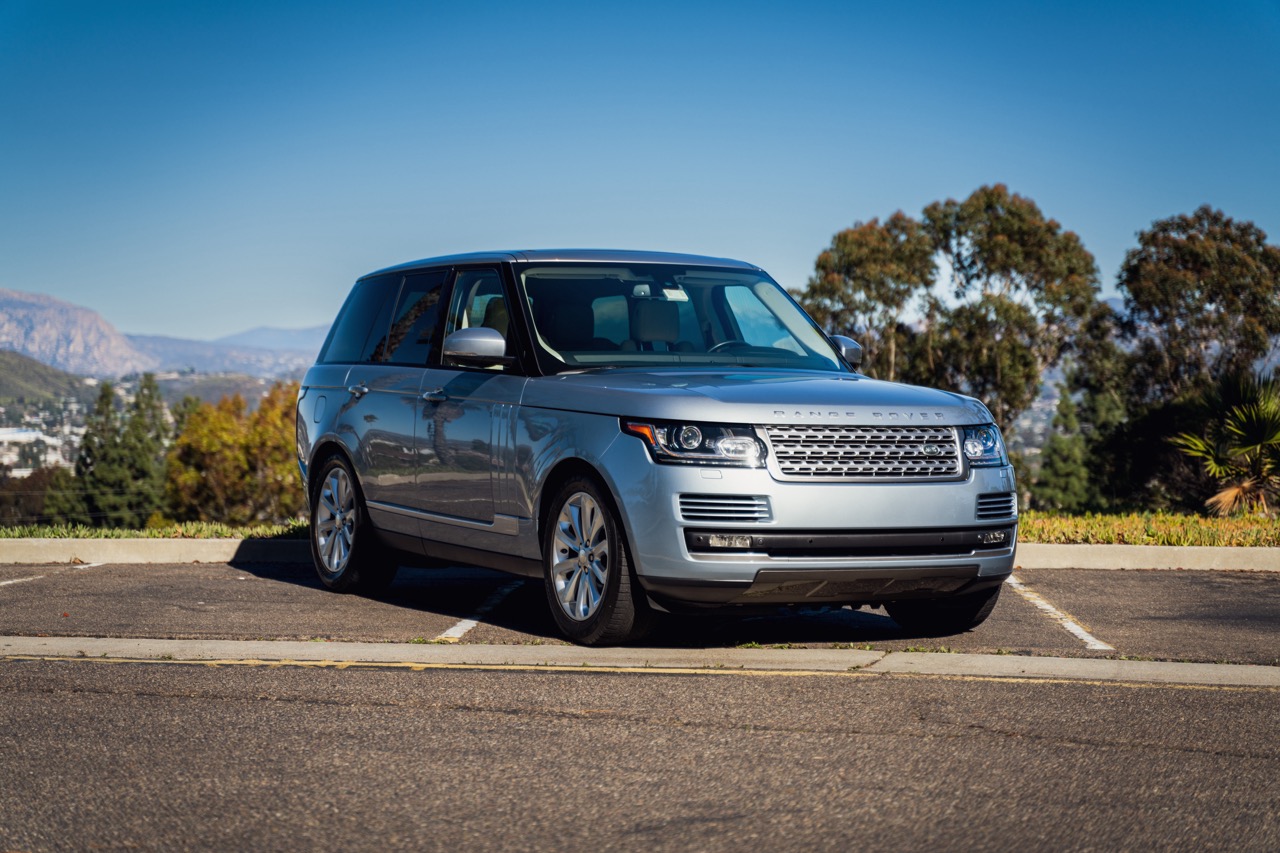
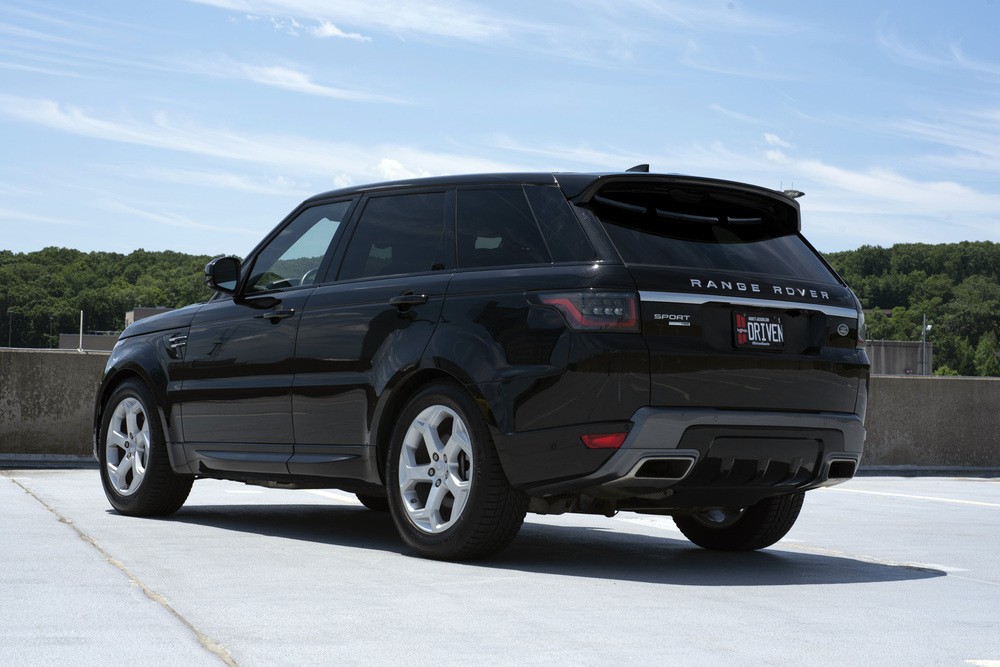


Frequently Asked Questions
Which car on this list has dropped the most?
The 2017 Land Rover Range Rover HSE Td6 Diesel leads the list, its verified sold prices falling 20.1% per year since 2023. No comparable sale since Nov 20, 2025, so this trend may not reflect today's market. That decline is exactly what makes it a buying opportunity. See its full price history on DriveIndex.
What do the cars on this list cost?
Market values across these 30 cars range from $12,311 to $179,977. Every value is computed from real sold prices (never estimates) and is recomputed twice a day as new auction results land.
Where does the data come from?
Every market value is backed by real sold prices aggregated from the world's leading collector-car auction houses and marketplaces, never estimates or speculation. Read how values are computed on the DriveIndex methodology page.
How often is this page updated?
Daily. New auction results are collected every day and values are recomputed twice a day, so this list of 30 cars re-ranks automatically.
Everything DriveIndex gives you
DriveIndex turns 246,000+ verified completed auction sales into the data collectors and enthusiasts use to buy and sell at the right time, not guesswork.
One clear recommendation per car so you know whether to pull the trigger, sit tight, or list it now.
The Appreciating / Stable / Approaching Bottom / Bottomed / Depreciating call for every car, with a sample-size-capped confidence score, computed from verified completed auction sales, not speculation.
The best and worst months to transact, from a seasonality model that strips out the underlying price trend.
A continuous price curve with an estimated bottom date, where a car is headed over the next five years, not a single hand-waved number.
Found a car for sale anywhere? Enter its ask and miles for an instant verdict vs a mileage-adjusted fair ask, great deal, fair, or overpriced.
Get pinged the moment a car lists or sells, filter by make, interior color, and equipment options.
See the full picture on the market
Browsing is free. Upgrade to unlock the Value Signal™, projections, and the tools collectors use to buy and sell at the right time.
- Full Value Signal™ + confidence: appreciating, stable, or depreciating
- 1–5 year price projections
- Buy / Hold / Sell call per car
- Complete sales & listings feed + up to 10 yrs of history
- Analyst notes & compare up to 4 cars
- Price & custom alerts (make, color, options)
- Portfolio tracker (garage) + analytics
- Everything in Pro, plus:
- Portfolio Outlook (a hold/sell call for every car you own)
- Watchlist Intelligence (act-now calls on the cars you follow)
- Head-to-Head Verdict (compare cars, the data crowns the buy)
- Market Deal Radar (every live ask under market value, catalog-wide)
- Best & worst months to buy and sell
- What each option adds to the price + separate manual vs automatic values
- Listing analyzer with fair-value deal scores
- Rad’s Market Update (his picks & price targets)
Get the live Value Signal, 1–5 year projections, the best months to buy and sell, and instant alerts when a car lists or sells. Free to start. Upgrade anytime.
Create your free account →